Hide
How to Draw or Edit a Parish Boundary
hide
Hide
Help and Guidance 2021: New Page: Version 1.1
Hide
Introduction
The GENUKI webpages for each parish include a map showing the location and the boundary of that parish; with the map linked from the Gazetteer entry for that place. This page gives you step-by-step instructions for creating a boundary for a parish that is currently missing, and for editing an existing boundary where that is in need of correction.
It is therefore also a useful illustration of how to position a standard tear drop marker in other uses of the maps in the Gazetteer and Churches Directory.
You will need:
- A Username & password which has “Editing” access for the Gazetteer entry for that parish.
- A reference resource, showing you the boundary of that parish on a modern map.
Setting Up
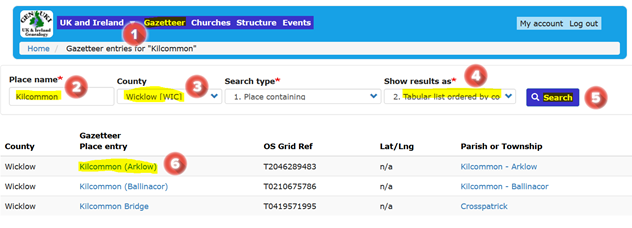
First, sign-in to your GENUKI account then, on any GENUKI webpage:
- Click on “Gazetteer” in the main menu.
- Fill-in the name of the parish.
- Fill-in the name of the County (to filter the search results).
- Select “Tabular list…”.
- Click “Search”.
- Click on the parish name in the “Gazetteer Place Entry” column
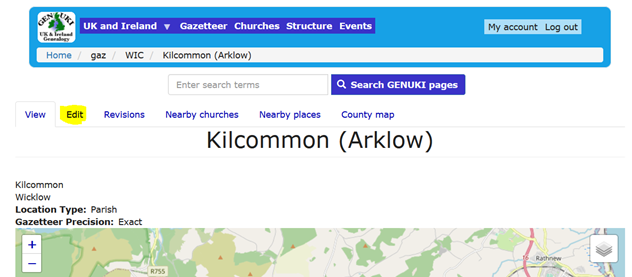
This will bring up a webpage for the Gazetteer entry for that parish and, if you do have Editing permission for this page, you will see an “Edit” tab near the top of the page:
Moving the Parish Teardrop-shaped map-marker
Having opened the “Editing” screen, concentrate on the map, which will look something like this example, which is for Kilcoole civil parish, in County Wicklow. The area shaded in blue represents this parish, surrounded by a blue line representing the parish boundary:
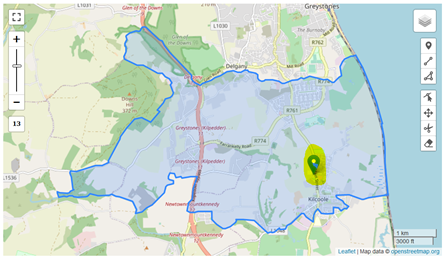
The blue teardrop-shaped map-marker (highlighted on the map above) is supposed to mark the position of this parish. Usually, the parish will have obtained its name from that of a town, village or (in Ireland) townland within its boundary; in which case the teardrop should indicate the centre of that settlement or townland. Otherwise, the teardrop icon should indicate the approximate geographic centre of the parish.
If necessary, you can move the position of the teardrop icon by clicking on the “cross” in the map menu, then moving the teardrop to the appropriate position, before clicking the “cross” again, locking it in its new position.
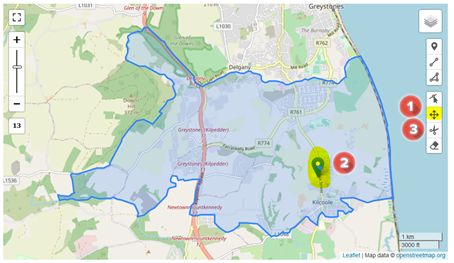
Note that, to help you find the appropriate position, you can zoom the map in/out (using the slider control on the left of the map) or view the map with different overlays (using the drop-down list under the layers icon, in the top right corner).
Once you are happy that the teardrop icon is in the correct location, save your changes by clicking either of the two Save buttons (on the left at both the top & bottom of that webpage). Then click on the Edit tab to continue editing.
Adding a missing Parish Boundary
If the boundary has not yet been drawn for a parish, the map on the Gazetteer page will still show a marker teardrop icon, but the blue line and shading will be missing; as in this example of Kilcommon parish in County Wicklow:
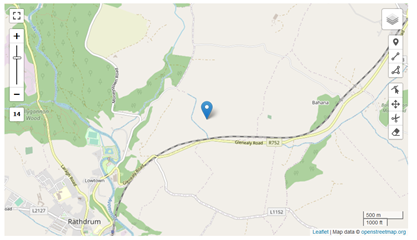
If so, then the first thing to do is make sure that the marker teardrop icon is in the correct position, as explained above. Then we can move on to drawing the parish boundary. To do that, we will create a basic polygon shape around the marker teardrop icon, then expand that to the rough shape of the parish, before refining that – a little at a time – to the actual shape of the parish boundary.
Drawing a Rough Polygon
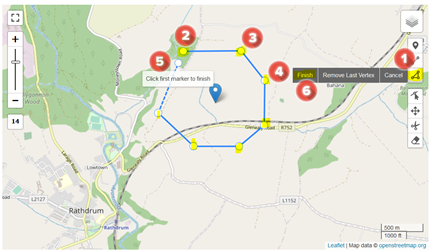
First, to draw the initial rough polygon:
- Click on the “Draw Polygons” icon, which is fifth from bottom icon to the right of the map.
- Using your mouse, create the first corner of your rough polygon, by left clicking on the map, somewhere near to the marker teardrop icon.
- Move the mouse pointer further around the marker teardrop icon and left click again, to create the second corner of your rough polygon.
- Repeat that process until you arrive back near your first “corner”.
- Click on that first corner to complete the polygon.
- Finally, click on Finish.
Now click on Save to save your changes.
Checking Progress
At this point, it is a good idea to check what your rough polygon looks like on the “County Map”, which you can get to by clicking on the County Map tab on the webpage for any place within that county. In our case, it looks like this:
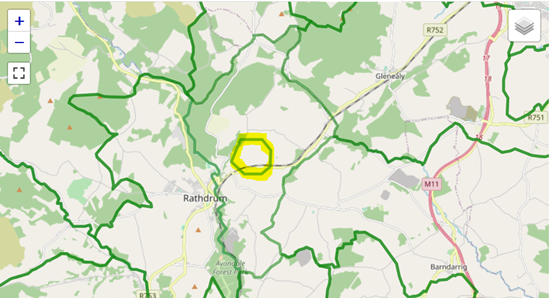
In this screenshot you can see the rough polygon (highlighted in yellow) in the centre of the map. The green lines on the map mark the boundaries that have already been drawn for adjacent parishes. Assuming that the boundaries of all the adjacent parishes have already been drawn (and assuming that they are all in their correct positions), then we would expect the boundary of Kilcommon parish to align with the existing green line and be the shape highlighted in yellow below:
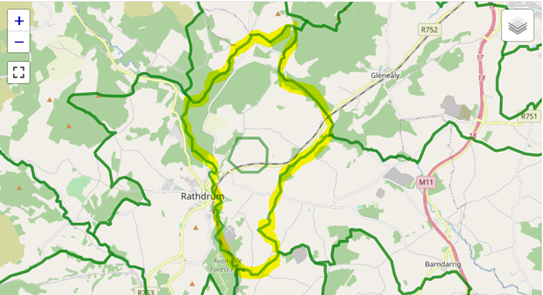
You can use the “County Map” to follow your progress as you refine your rough polygon, so it may be a good idea to keep it open (in a separate Web Browser window or tab) whilst you are editing. Remember that you will need to “Refresh” that page to update it to see any changes you have made to the polygon!
Refining the Rough Polygon
Back in the Edit screen, our next task is to enlarge our rough polygon, so that it more closely resembles the actual parish boundary, albeit still only a very rough outline of that boundary. To do this:
- Click on the “Edit Layers” icon, fourth from bottom to the right of the map.
- Click on one of the corners of your polygon and drag it into a new position.
- Repeat that to move another corner.
- When you have finished moving the corners, click on Finish.
Now click on Save to save your changes.
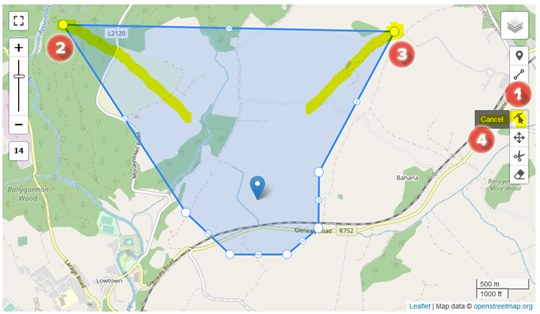
Remember that, to help you move the corners to the “right” position, you can zoom the map in or out, and you can switch back & forth between the overlays (as explained above for moving the teardrop icon).
In this example we started out with a seven-sided rough polygon and, at our first go at refining the shape, we have moved those seven “corners” out to roughly somewhere near the actual parish boundaries. What we now have looks like this in the Edit screen and County Map respectively:
To get even closer to the shape of the parish boundary, we are clearly going to need a polygon with many more “corners”. So how do we do that?
Adding new Sides to the Polygon
Back in the Gazetteer entry Edit screen:
- Click on the “Edit Layers” icon, fourth from bottom to the right of the map.
- Click on one of the smaller (mid-point) circles on one side of the polygon. That changes into a new additional “corner” of the polygon, which can be repositioned, just like the other corners.
- Two new mid-point circles appear either side of the new “corner”.
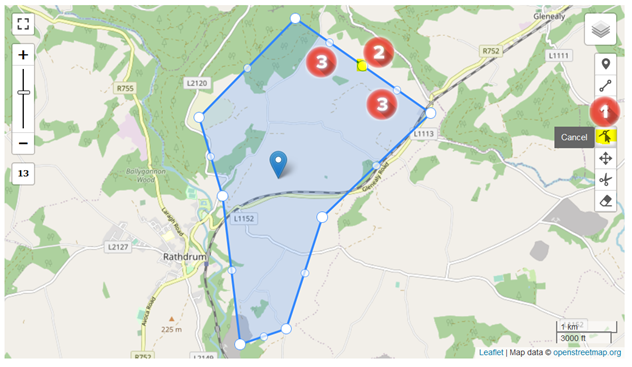
Create as many new “corners” as you need and move each one to an appropriate position. When you are ready to check on your progress (against the County Map), click on Cancel against the “Edit Layers” icon, and Save the changes.
What we now have looks like this in the Edit screen and County Map respectively:
The Completed Boundary
All that remains is to repeat the “Adding sides to the polygon” process, zooming closer in on the map to refine the boundary as close as you can get it.
There should be no gaps between the parish boundary and those of adjacent parishes, nor any overlaps with adjacent parishes. Both would be indicated by some thinner stretches of the green boundary lines. The finished result looks like this in the Edit screen and County Map respectively:
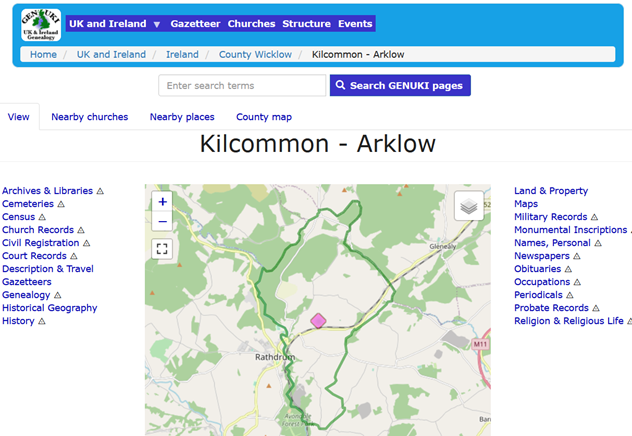
The GENUKI “Place” webpage for the parish will now also show the parish boundary:
